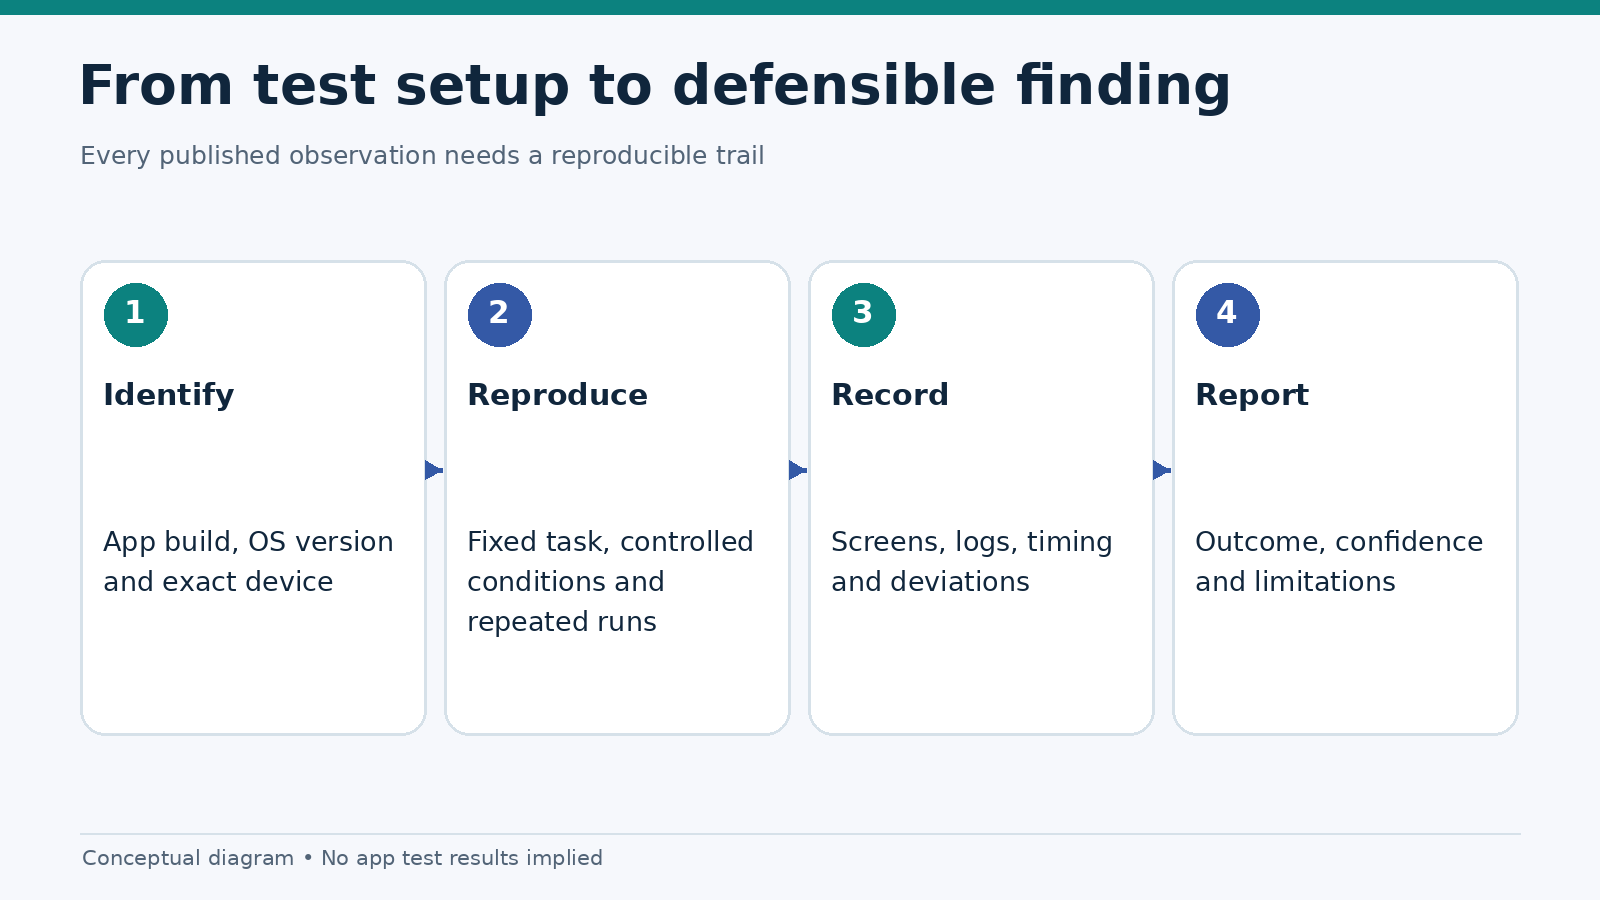
A fair 4G-versus-Wi-Fi loading test holds the device, app version, account state and task constant while changing only the measured network conditions. Otherwise the difference may come from caching, background activity or the server rather than the connection. This article sets out the precise protocol, measurements and reporting rules for comparing gambling app load times. No app load-time measurements have yet been collected for this draft.
Why compare these two connections? A Wi-Fi icon does not guarantee a responsive network, and a cellular label does not guarantee slower loading. Congestion, latency, packet loss and local routing influence the result. More importantly, the first usable screen is often not the same as the first painted screen. Our technical testing methodology explains the broader review framework; this experiment focuses exclusively on network-dependent loading.
Define the screen before the stopwatch
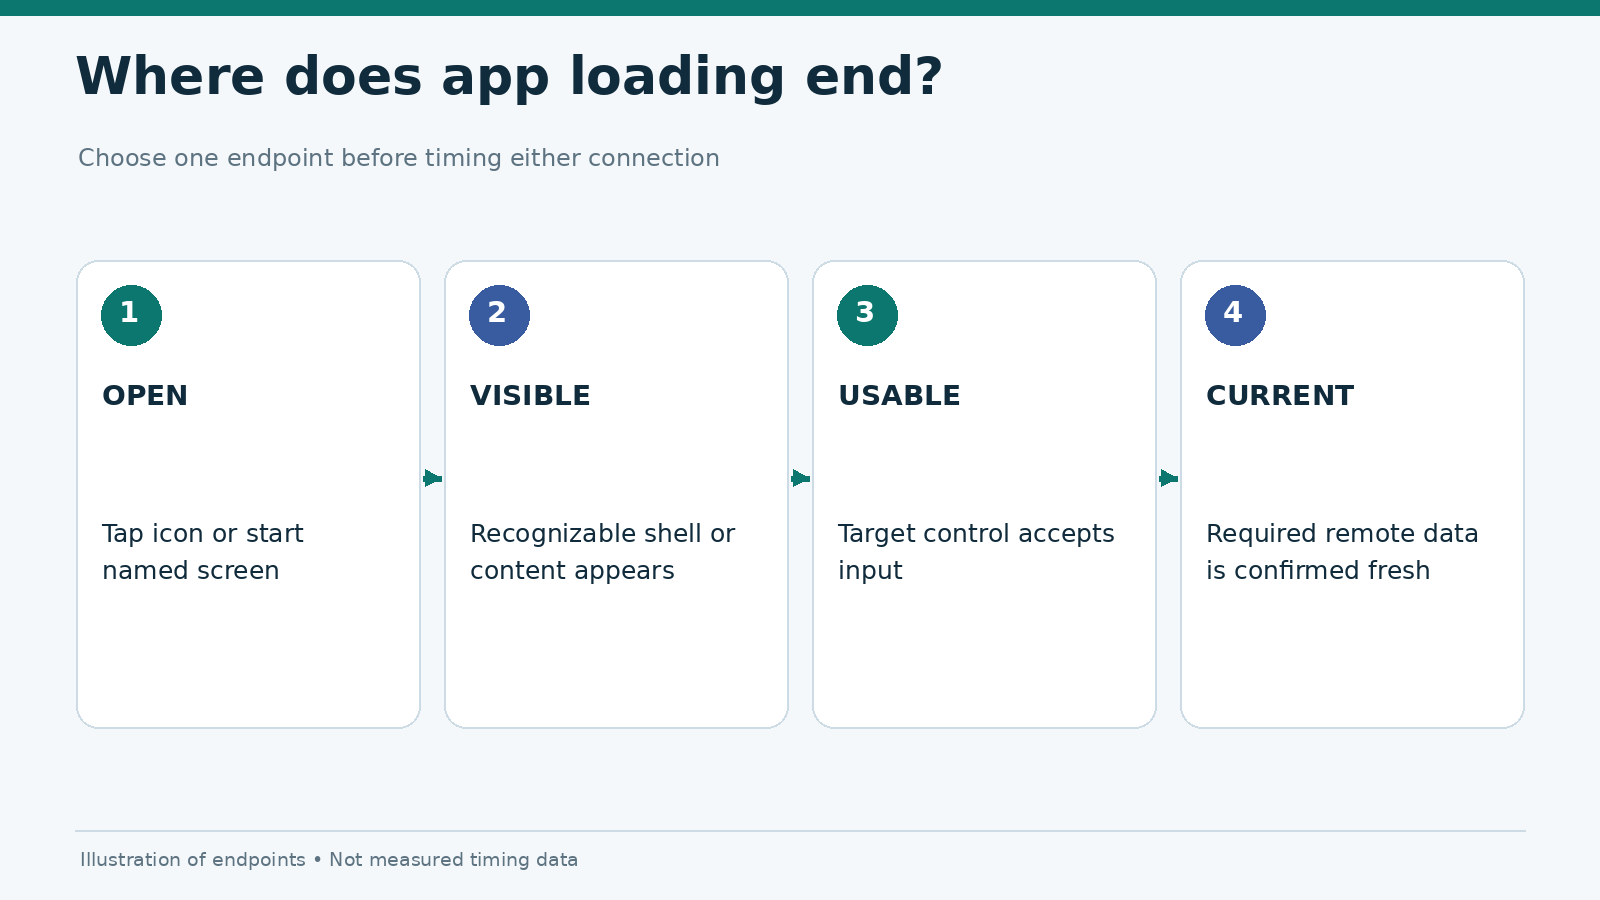
A single phrase—“app load time”—can represent several events. Specify the event before comparing two runs.
| Measurement | Starts | Stops | What it does not prove |
|---|---|---|---|
| Cold launch to visible shell | App opened from a closed state | First recognizable app screen | Data is current or interactive |
| Launch to usable navigation | App opened from same starting state | Target control reliably accepts input | Remote data has finished loading |
| Task screen load | Navigation action begins | Target screen visibly finishes loading | All live account records are refreshed |
| Error recovery | Timed request or screen transition begins | Usable retry, error or completed screen | That funds or transactions are consistent |
For a web app, the browser’s Navigation Timing API offers technical milestones such as domInteractive and loadEventEnd. Those are not direct equivalents of a native app’s user-facing usable-screen time. MDN explains the fields in its Navigation Timing reference. Define a visible end condition for both technologies and treat internal diagnostic timings as supplemental.
The test task must avoid wagering or handling real funds. Use a permitted test account and non-transactional screens when possible. Record whether an account login, geo check or age gate makes an equivalent comparison impossible.
Control the device and network variables
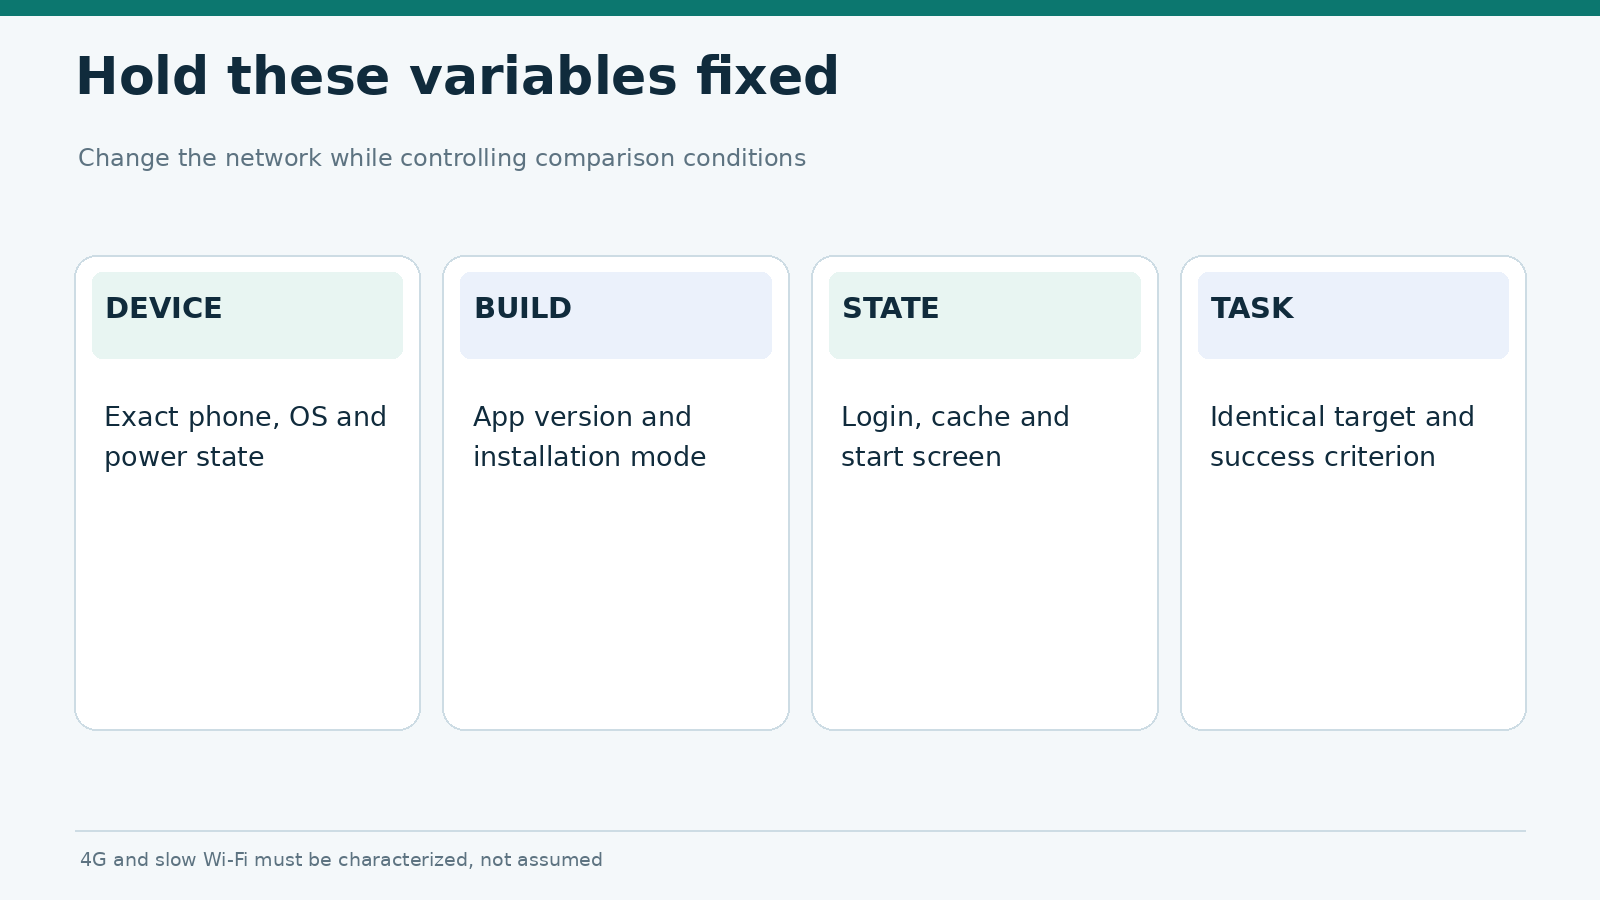
A sound test records at least these conditions:
- Device: manufacturer, model, operating system, memory class and battery/power state.
- App: exact version and build, native or PWA status, installation source and account state.
- Connection: whether the link is measured cellular 4G, real Wi-Fi or an emulated profile; bandwidth, round-trip latency and packet loss where available.
- Cache: cold start versus warm start, browser cache/service-worker state and any known application caching.
- Task: identical home screen, identical target destination and identical success criterion.
- Time: UTC timestamp, test session, geography authorized for access and known interruptions.
Actual 4G and throttled Wi-Fi are not interchangeable laboratory labels. A cellular connection has radio behavior that an emulator may not reproduce. A “slow Wi-Fi” profile should be reported as a measured local connection or a synthetic profile with explicit settings—not as a universal Wi-Fi speed.
For browser-based testing, Chrome DevTools supports custom download, upload and latency profiles. Its Network tools also allow cache controls and network emulation. Google cautions that desktop CPU throttling does not truly reproduce a phone’s processor architecture; see the Performance panel reference. Document whether a test uses a physical handset, remote debugging or a desktop approximation.
Suggested minimum run sequence
- Verify the app can open under the target country’s rules and the test account is authorized.
- Fix the device, app build, target screen, permissions and account state.
- Check the connection profile and record its measured conditions.
- Perform three untimed warm-up visits to identify setup errors; exclude them from the reported sample.
- Run at least ten timed trials per connection, alternating connection order in blocks to reduce time-of-day bias.
- Record the timing and outcome for every trial, including failures and timeouts.
- Repeat on another day if practical; label all runs by session.
Ten trials is a proposed editorial minimum, not an official industry mandate. More repeats may be necessary if timings vary widely. A trial that times out is not a slow successful load; retain it as a distinct outcome rather than replacing it with an invented number.
How to report a result without hiding variability
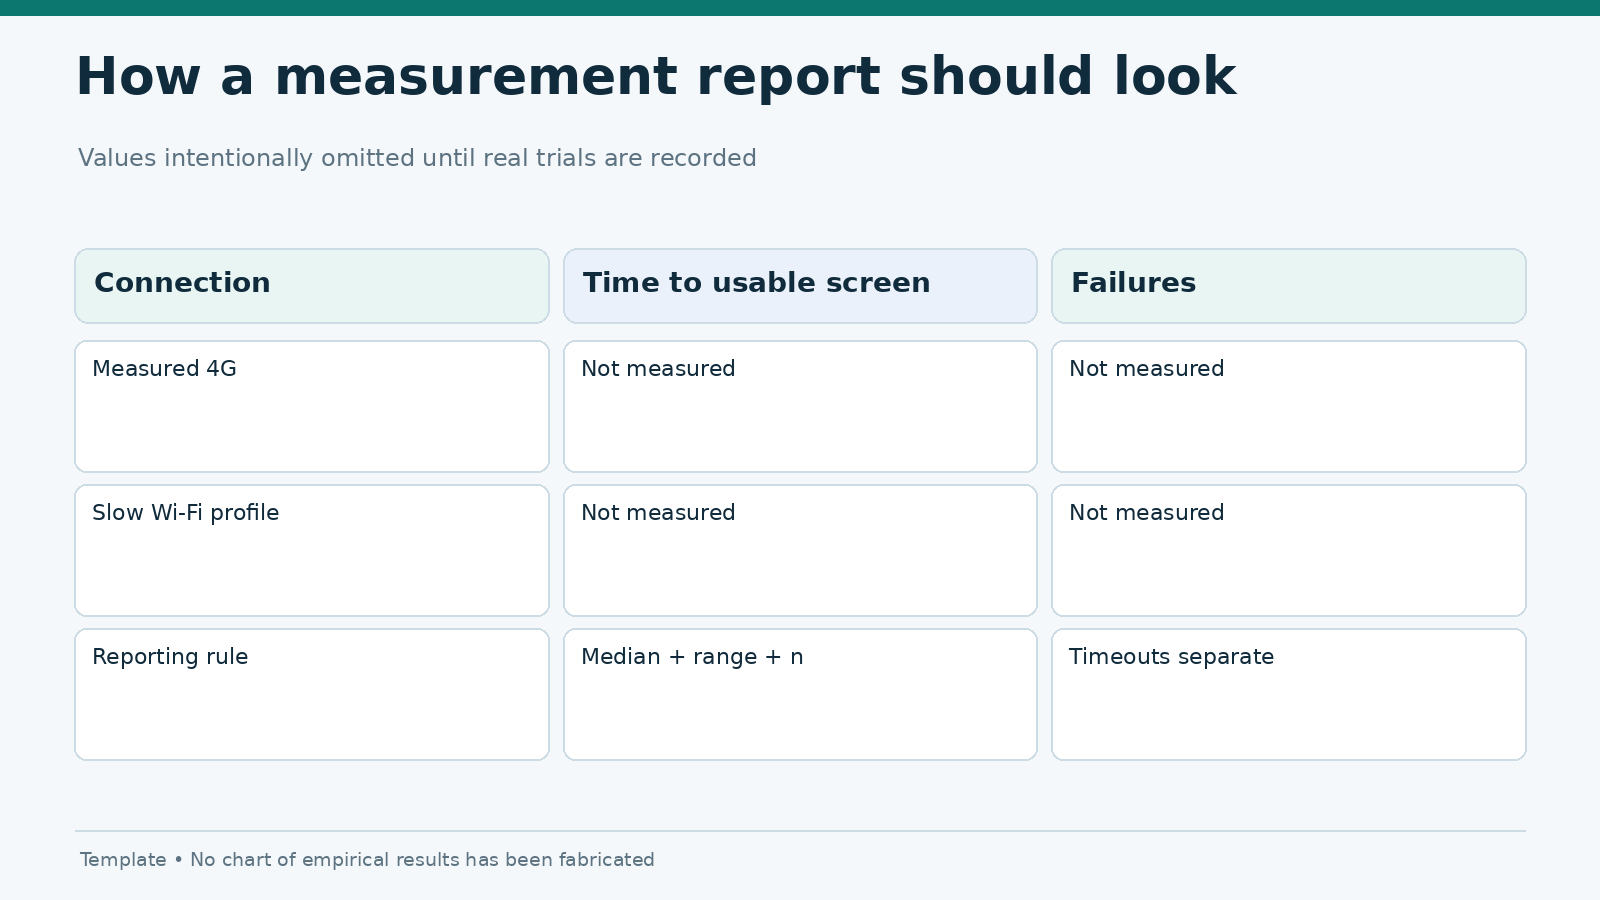
Use the median as the headline timing when enough successful runs are available, with the sample count and observed range nearby. The median resists a single extreme delay better than the mean, but it does not excuse deleting failed runs. Publish timeout rate separately. If a screen sometimes fails completely, “fast median load time” would be misleading by itself.
The template below intentionally contains no benchmark figures:
| Network condition | Successful trials | Median time to usable screen | Observed range | Timeouts |
|---|---|---|---|---|
| Measured 4G | Not tested | Not measured | Not measured | Not measured |
| Measured or emulated slow Wi-Fi | Not tested | Not measured | Not measured | Not measured |
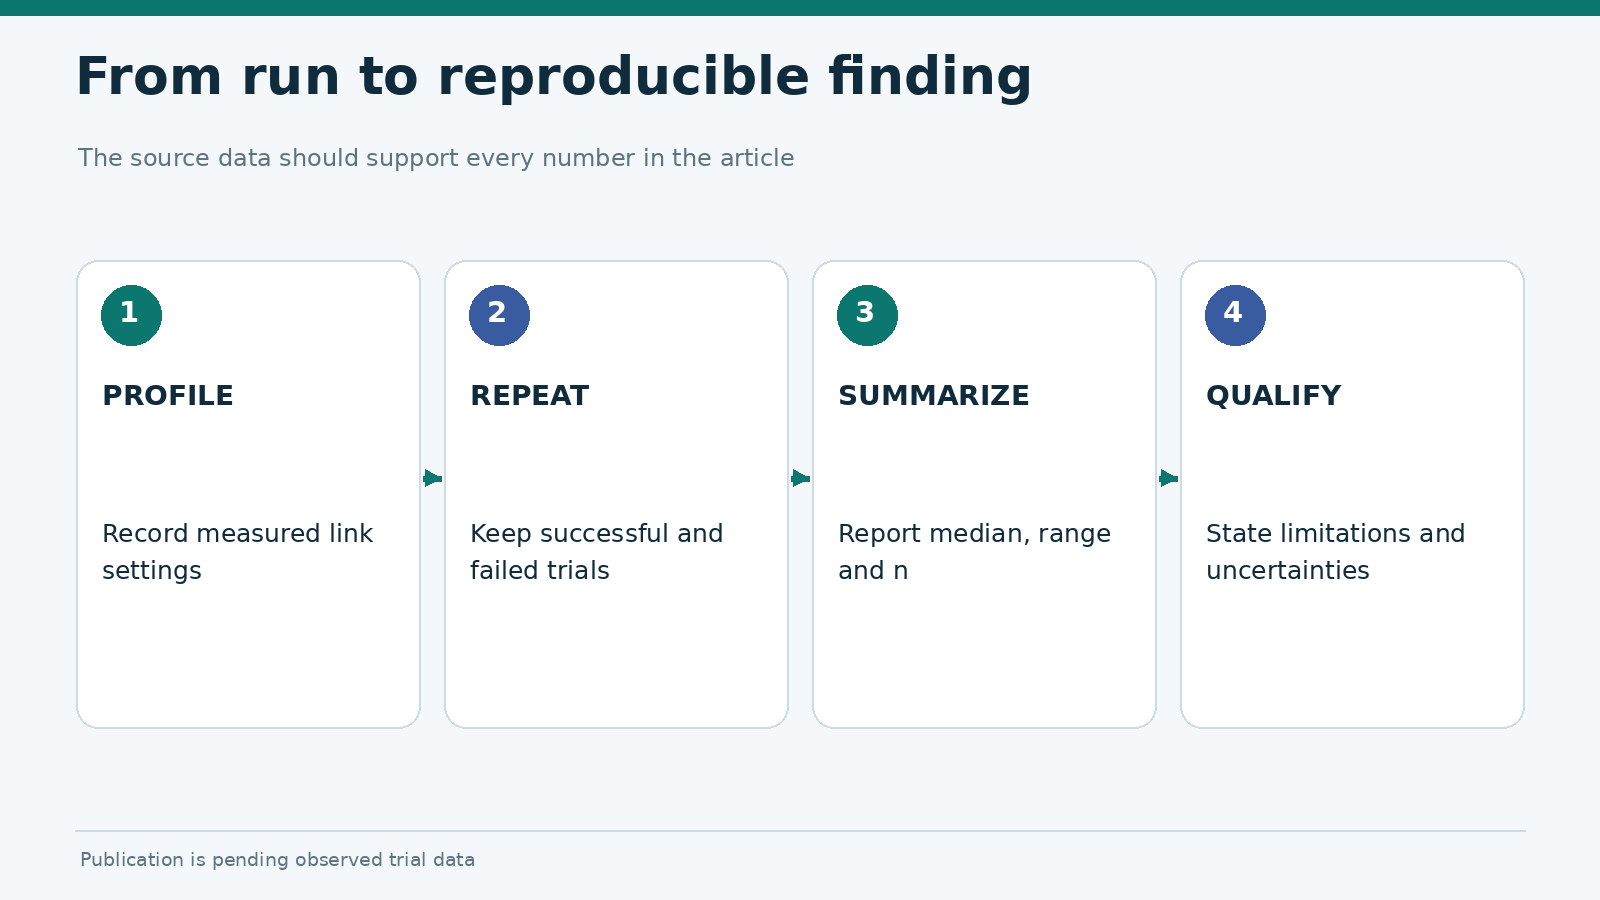
Every eventual number should be traceable to a timestamped row in a raw log. Attach a chart only after there are real trial results. A box plot or dot plot of observed measurements is more useful than a decorative bar graph with invented heights.
A reasonable raw-data layout includes trial_id, app_build, device, network_profile, cache_state, start_timestamp, usable_screen_ms, outcome and notes. Keep account identifiers out of public exports. For reproducibility, describe who performed the trials and whether the measurements were hand-timed from video or captured by an instrumented event.
Warm launches deserve their own table
A warm launch can reuse state, memory and cached content. It should not be mixed with a cold launch when computing medians. On some platforms a process that appears closed may still remain in memory. Record the actual reset procedure. If the study cannot reliably determine the process state, call the result a “repeat launch” rather than claiming it was cold.
Service workers, HTTP caches and CDN behavior can also change repeated PWA visits. Browser developer tools help reveal request reuse, but the same diagnostic access might not exist for a closed-source native app. A fair comparison can still rely on user-visible milestones while admitting that the internal causes remain unverified.
Common ways this experiment goes wrong
Comparing 4G today with Wi-Fi tomorrow
Server load, remote-service behavior and app content change over time. Alternate conditions within the same session where feasible; otherwise explain the unavoidable time gap. Exact repetition does not eliminate remote variability, but it helps detect it.
Ignoring the mobile network outside the label
“4G” covers a wide range of radio and transport conditions. Capturing signal state, measured throughput and latency gives the result meaning. Similarly, a Wi-Fi network may be locally strong but connected to a congested internet uplink. Record the actual path you tested instead of assuming the icon describes the user experience.
Timing the splash screen rather than a useful task
A branded launch screen can appear instantly while controls remain blocked. State whether the endpoint is first paint, navigation-ready or data-ready, and do not switch definitions after seeing results. A visual recording provides a useful check when automated event marks are unavailable.
Mixing stability with speed
If a page crashes, times out or enters a permanent spinner, do not assign it an arbitrarily large successful load time. Report failure separately. The frame-drop performance experiment addresses animation smoothness, not network waiting. The budget-phone roundup will interpret device limitations only when tested data exist.
When will this be a publishable controlled test?
A genuine finding requires source files, a run table, software versions, the physical or emulated network settings, and a clear distinction between measurements and interpretation. If two conditions overlap heavily, report that ambiguity. Do not announce a winner simply because one median is numerically smaller without considering range, sample size and failures.
A reviewer should be able to answer five questions from the published page alone: What exact screen was timed? What device and build were used? How were 4G and Wi-Fi characterized? How many trials succeeded or failed? Can the raw observations support the summary?
Frequently asked questions
Is 4G faster than slow Wi-Fi for gambling apps?
There is no universal answer. Real throughput, latency, congestion, server behavior and caching decide the result. This draft contains no observed comparison.
Does a faster splash screen mean a faster app?
No. The relevant endpoint should be the moment a user can complete the named task, not merely see a logo.
Can Chrome DevTools replace testing on a phone?
It helps diagnose web loading and emulate network restrictions, but it does not reproduce every property of a real mobile device or cellular connection.
Can launch time predict the quality of a gambling operator?
No. Loading measurements do not establish licensing, payment integrity, security or suitability for any user.
Evidence status: Data collection pending. This manuscript is a protocol and publication-ready outline for a controlled experiment, not a report of completed measurements. The production headline and numerical charts must be reviewed after real test runs.